11.5 Standardized Regression Coefficients
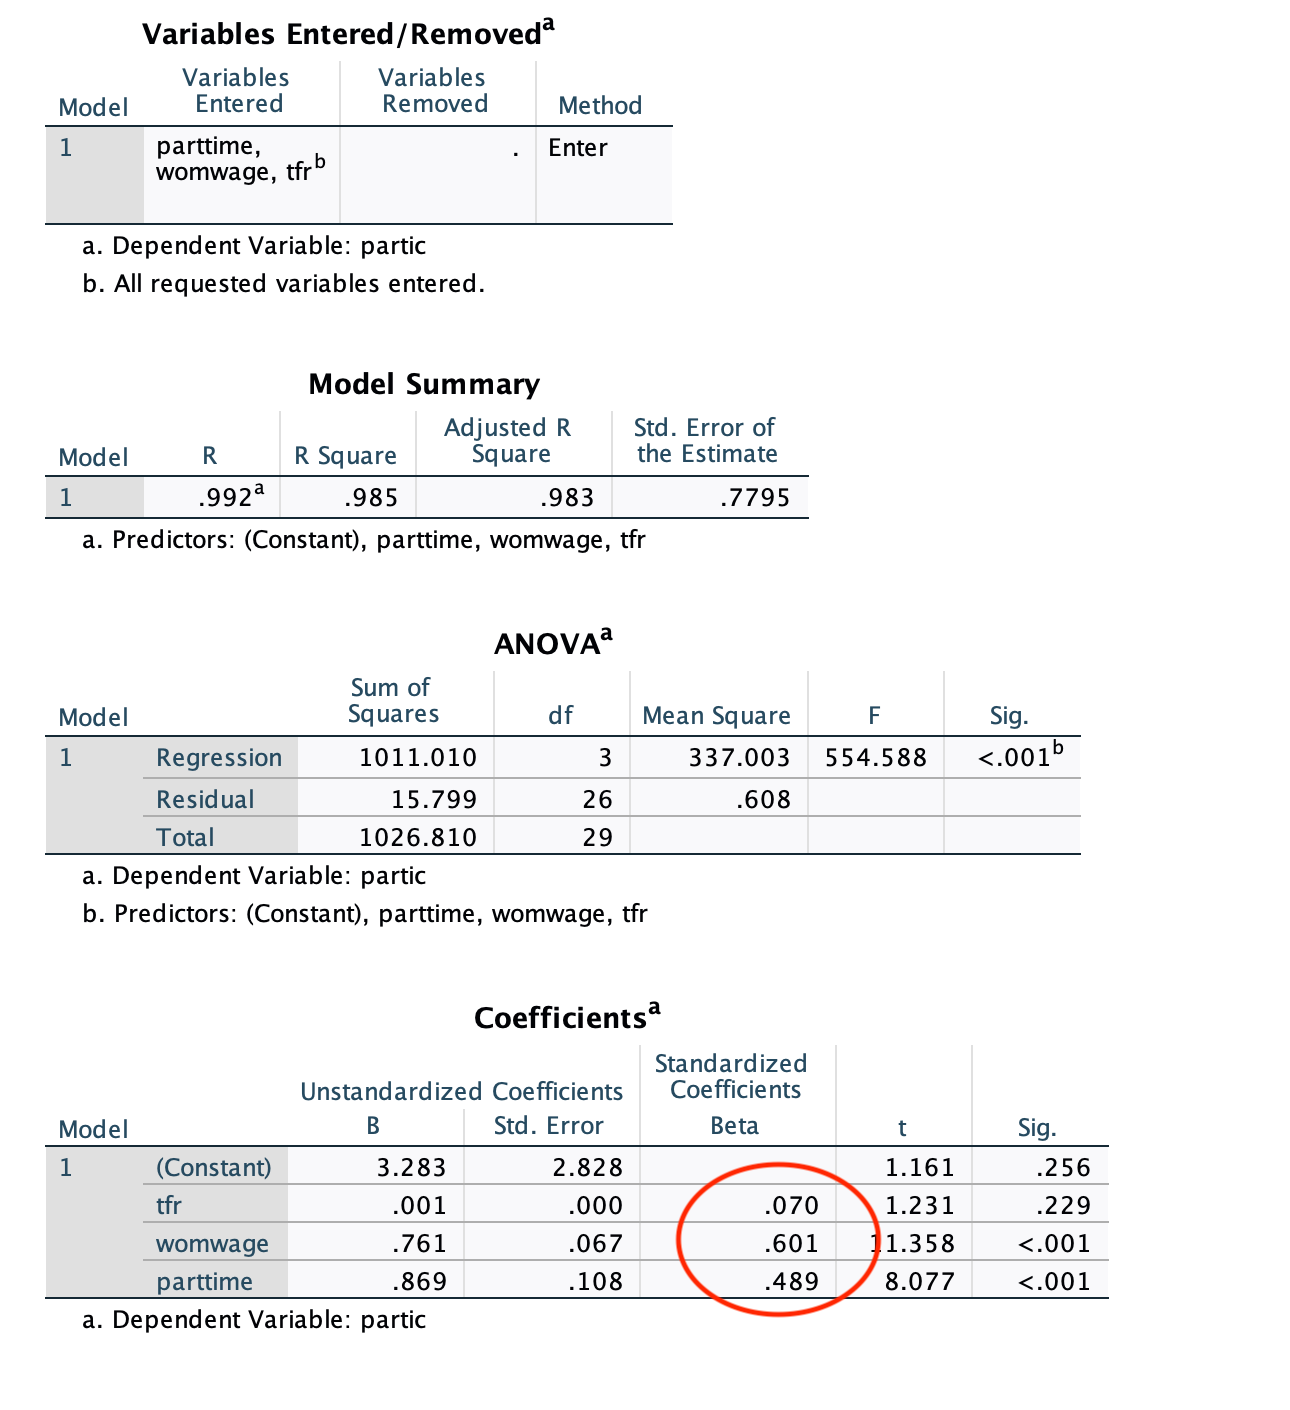
There is no way to calculate standardized regression coefficients in R Commander. In SPSS, however, the standardized coefficients are displayed automatically.
 Each standardized regression coefficient indicates the predicted change (in standard deviations) of women’s labour force participation with a 1-standard deviation increase in the relevant predictor:
- A 1-standard deviation increase in fertility rate is associated with a 0.07-standard deviation increase in women’s labour force participation.
- A 1-standard deviation increase in women’s wages is associated with a 0.60-standard deviation increase in women’s labour force participation.
- A 1-standard deviation increase in part-time work rate is associated with a 0.49-standard deviation increase in women’s labour force participation.
This helps us compare the strengths of the different predictors. We can conclude that women’s wages are the strongest predictor of women’s labour force participation in this model.
To report standardized regression coefficients in APA format, add “β = ?” after each unstandardized coefficient (B).
A linear regression model found that the predictors women’s wages, fertility rate, and part-time work together accounted for a significant proportion of variance in women’s labour participation rate, F(3, 26) = 554.6, p < .001, R2 = .98. Women’s wages were significantly positively associated with labour participation, B = 0.76, β = 0.60, p < .001. Fertility rate was not significantly associated with labour participation, B = 0.001, β = 0.07, p = .23. Part-time work rate was significantly positively associated with labour participation, B = 0.87, β = 0.49, p < .001.