11.3 Cohen’s d
Cohen’s d is commonly used as an effect size for independent samples t tests. You can review the video or transcript for these analysis if you need a refresher.
Unfortunately, there is no way to directly calculate Cohen’s d in R Commander; however, you can use the following simple formula to calculate it:
d = 2 * t / sqrt(df)
In the lab on independent samples t tests, we obtained the following output:
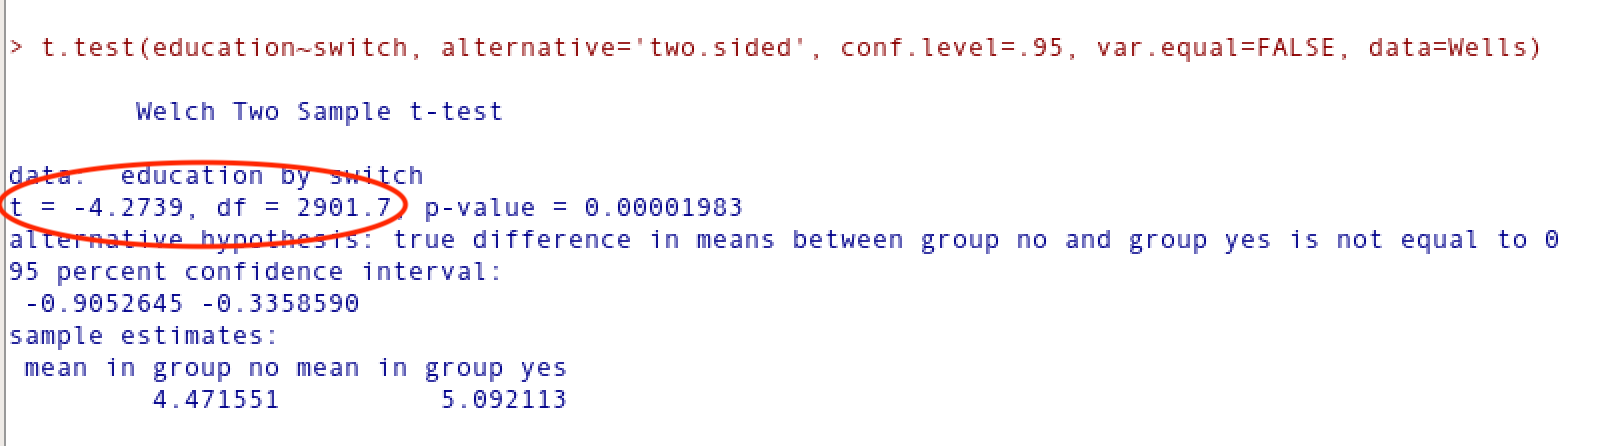
From this output, we can see that t = -4.2739 and df = 2901.7. Therefore,
d = 2 * -4.2739 / sqrt(2901.7)
d = -0.159
Cohen’s d is produced automatically in SPSS. The value may differ slightly from the value you calculated above. The details of why these programs produce different values is not something you need to understand for this course.
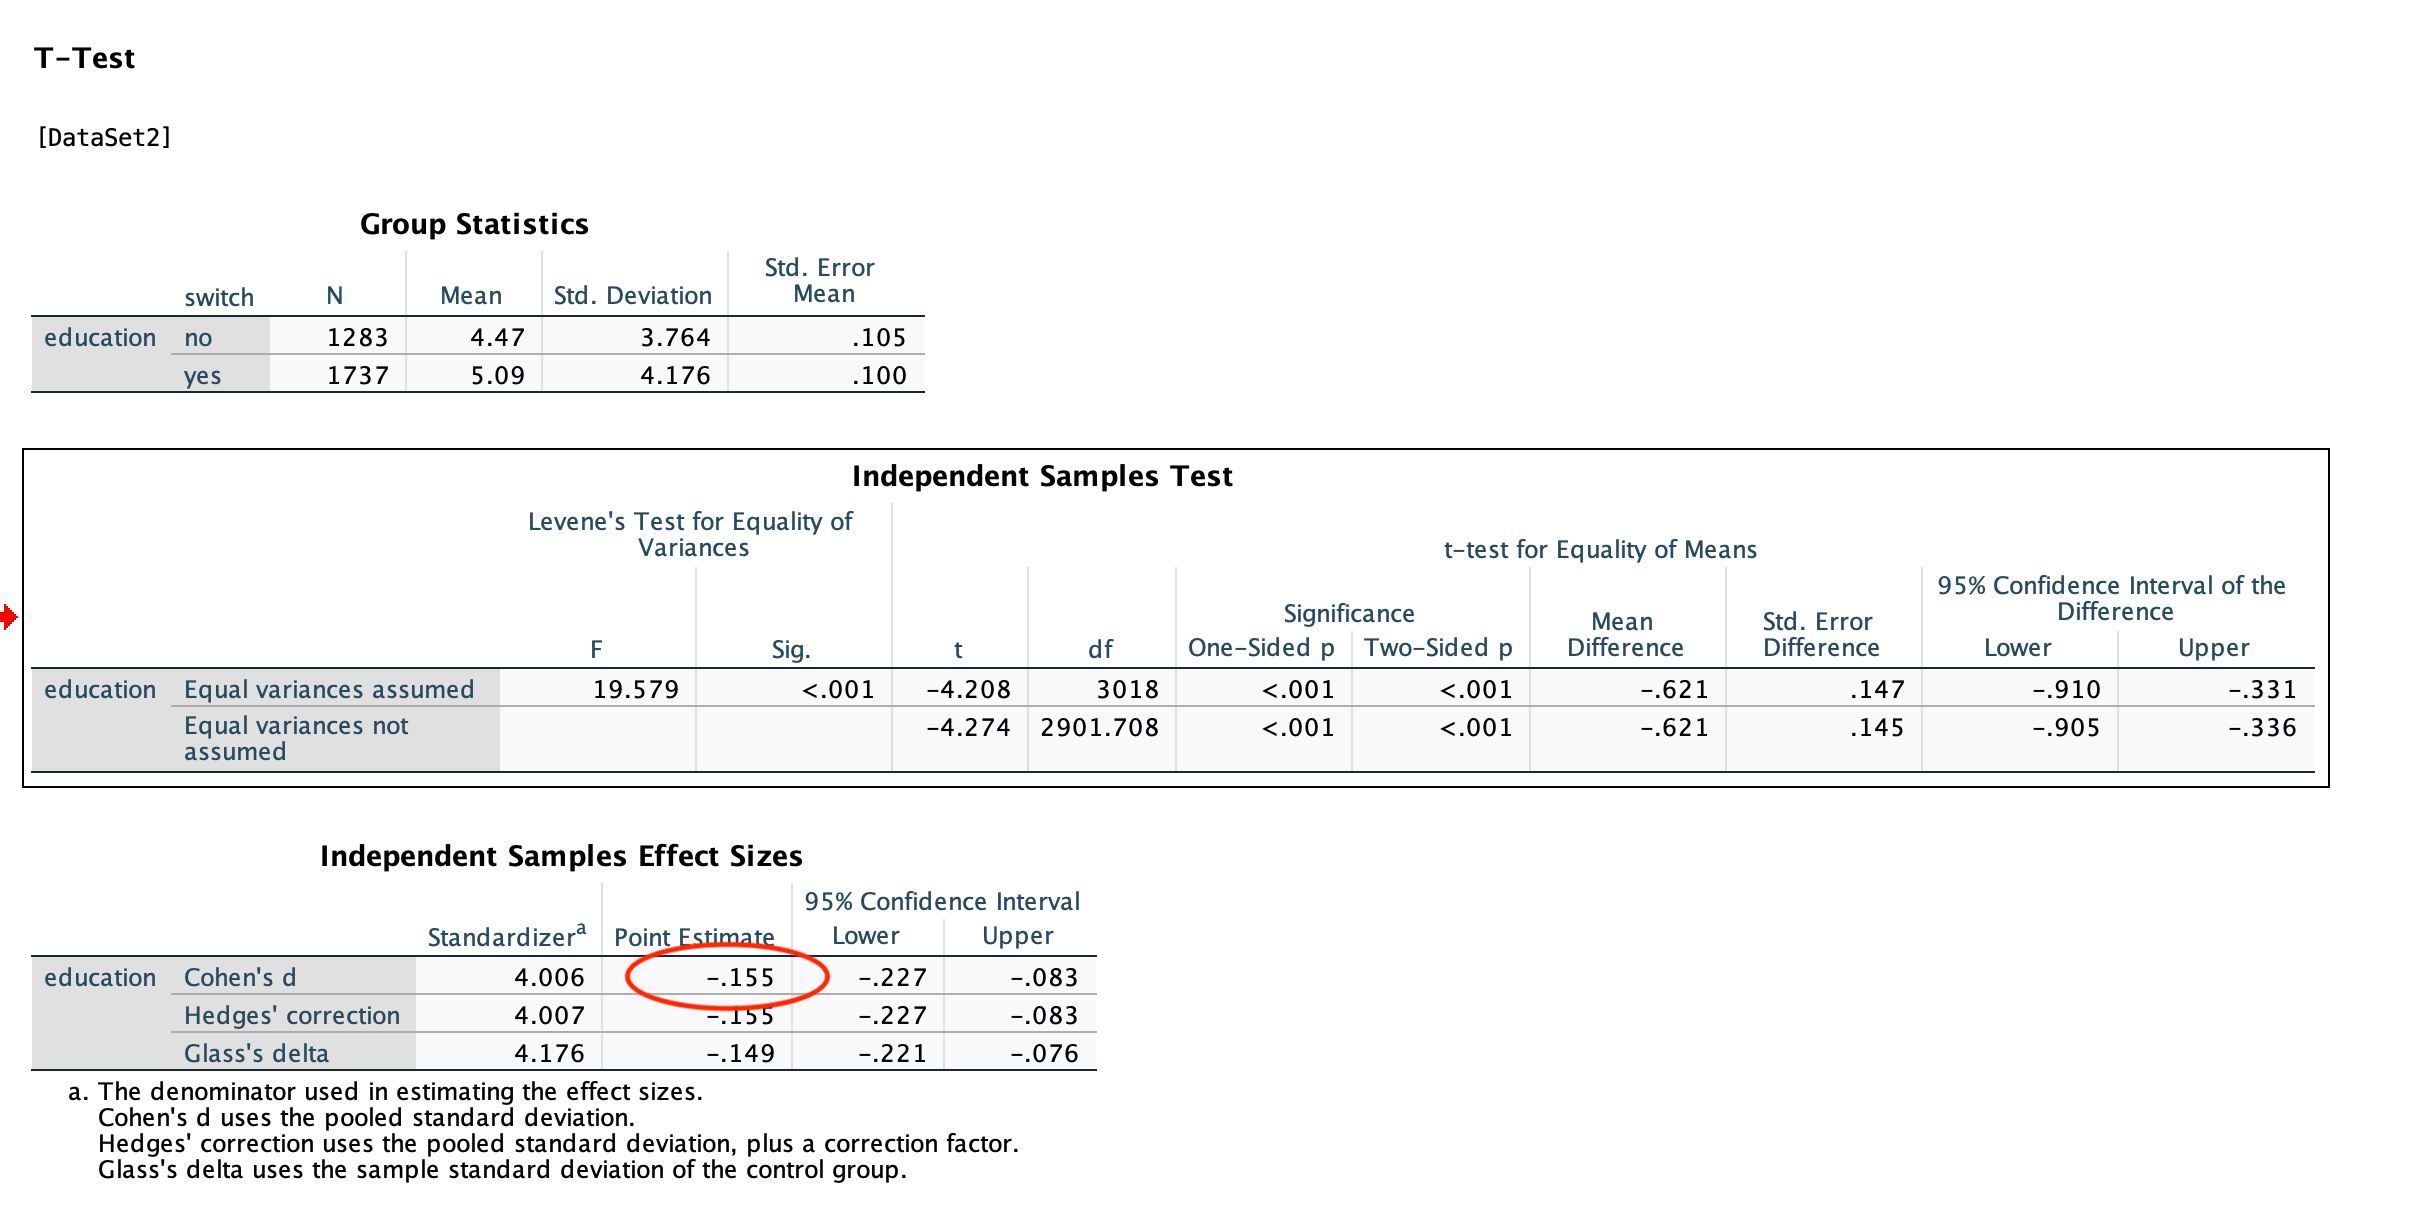
These values indicates that households that did not switch wells had heads of households with education levels that were 0.16 standard deviations lower compared to households that switched wells.
To report Cohen’s d in APA format, add “d = ?” to the end of your results.
An independent samples t test found that households that switched to a new well (M = 5.09, SD = 4.18) had heads of households who were significantly more educated compared to households who did not switch to a new well (M = 4.47, SD = 3.76), t(2902) = -4.28, p < .001, d = 0.16.